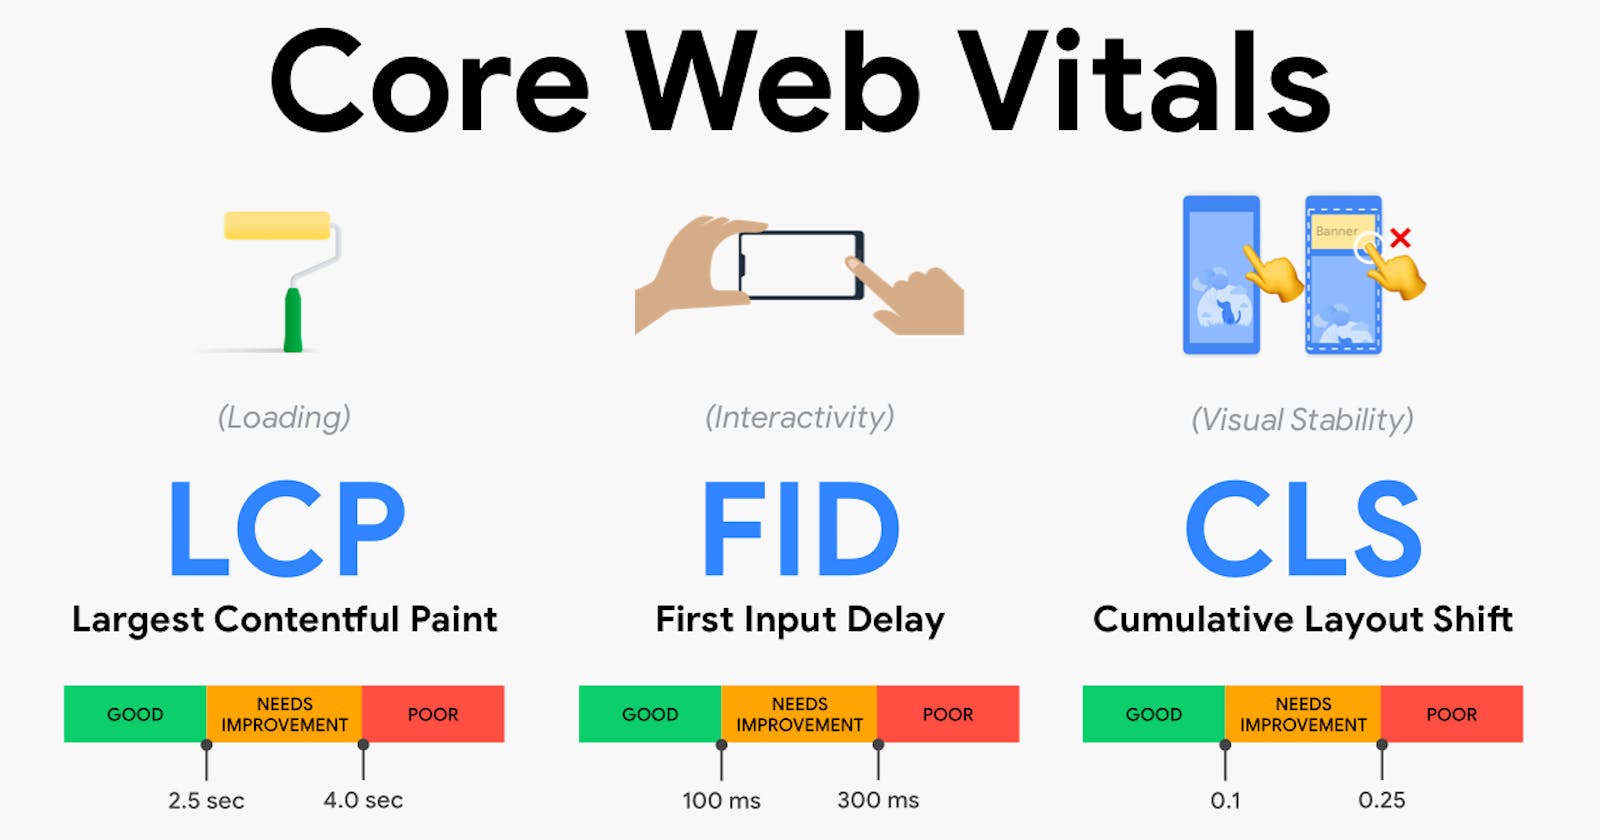


Since its introduction in early 2020 by the Google Chrome team, the Core Web Vitals (CWV) has been the most reliable and widely used metric for measuring the performance and quality of websites. It relies on three foundational principles: the loading performance, interactivity, and visual stability of a page. In addition, a good CWV score guarantees a good user experience and elevates the site's ranking on Google's search engine.
This article will help you understand all you need to know to develop webpages with good enough scores, an improved user experience, and SEO rankings.
This article requires that you have at least a basic understanding of website development or design. That said, let's dive straight into the pool.
What Exactly are the Core Web Vitals?
Google gave us the three key metrics for evaluating web performance:
Largest Contentful Paint (LCP)
First Input Delay (FID) and
Cumulative Layout Shift (CLS)
But let's have a look at each one of them in detail to better understand how they work and the best practices to improve the score on each of them.
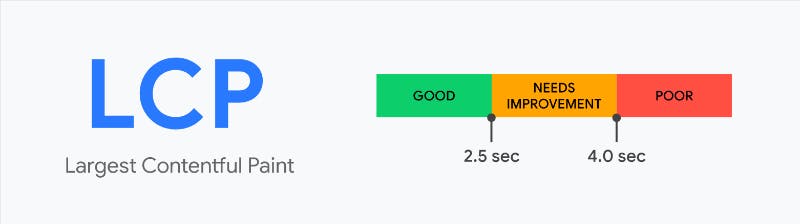
Largest Contentful Paint (LCP)
Arguably the most impactful and noticeable metric for page performance, the Largest Contentful Paint (LCP) is defined as the point in the page loading period where the site's main content becomes visible on the viewport. In other words, it is the time it takes for the largest image or text block to load in relation to when the page first started loading.
What are the Elements Involved?
The standard elements considered in evaluating LCP are:
<img>elements<image>elements inside an<svg>element<video>elements with a poster image (the poster image load time is used)An element with a background image loaded via the
url()function (as opposed to a CSS gradient)Block-level elements containing text nodes or other inline-level text elements as children.
Research is still being conducted for additional elements to be added in measuring with this metric, such as video elements without poster images, elements with SVG support and so on.
However, some exceptions do occur with elements that are considered 'non-visible' or 'non-contentful' to the user. Examples include:
Placeholder images
Elements with an opacity of zero
Elements that cover the full viewport, considered as background rather than content
How Good is a Good LCP Score?
To provide an excellent user experience, sites should have an LCP score of 2.5 seconds or less. Anything above 2.5 seconds is considered poor.
How to Measure the LCP
To measure LCP as well as other core web vitals, certain software tools are commonly used. These tools are broadly classified into Field tools and Lab tools.
Field tools are operated by using them to collect data from real-time users and their experiences. On the other hand, Lab tools try to simulate users' experiences in a test environment.
Neither of these options is necessarily better or worse than the other—in fact, you generally want to use both to ensure good performance.
Field tools
Lab tools
How to Improve LCP
There are several factors to consider for a webpage to have an improved LCP score. The common factors for a poor LCP score include slow server responses, large JavaScript bundles being shipped to the browser, a lack of caching, and so on.
Here are ways you can improve your LCP time significantly.
Improve Server Response Time: The time it takes for a server to respond to an HTTP request is very critical to improving the LCP of any webpage. Actions such as implementing server-side caching, optimizing your server-side logic (e.g., database queries), upgrading to a more efficient server, etc. can significantly improve your server response time.
Use a Content Delivery Network (CDN): A CDN is a group of servers that are geographically distributed. CDNs cache the content of a website or web app to ensure very fast delivery of a webpage when an HTTP request is sent. On top of that, only the CDN server nearest to the geographical location of the user will deliver the content. This will drastically improve the load time and LCP of a webpage as compared to when the response is coming only from the origin server.
Thankfully, most modern frontend frameworks like Nextjs now offer CDN deliveries in production versions of your website or web app,
Optimize Images: As we may know, images are the biggest culprits when it comes to slow page load times; therefore, optimizing images is crucial. Using third-party services like kraken.io or imgix.com delivers a well-compressed version of your media, and saves you bandwidth. Additionally, using the WebP format for your images further reduces their size.
Preload Critical Elements: Resources like large, noticeable images impact LCP. These large visual resources can be preloaded and prioritized by the browser. One good example is to preload banner or hero images by adding a
<link>tag with arel= "preload"attribute to the head section of your HTML document.<!-- preloading the hero image --> <link rel="preload" src="hero_image.jpg" />
Luckily for us, frameworks like Nextjs make it even easier to deal with LCP images and text blocks, you simply need to add a 'priority' prop to the image, and Nextjs will prioritize the image for loading (e.g. through preload tags or priority hints), leading to a meaningful boost in LCP. Here's an example snippet in Nextjs:
import Image from 'next/image'

export default function Home() {
  return (
    <>
      <h1>My Blog Homepage</h1>
      <Image
        src="/egusi-soup.png"
        alt="Hero Image"
        width={500}
        height={500}
        priority
      />
      <p>Welcome to my blog!</p>
    </>
  )
}
If you happen to be working with raw HTML, take advantage of the <picture> tag for example, which helps the browser prioritize image requests more intelligently.
Eliminate Render-Blocking JavaScript and CSS: When the HTML is sent from the server to the browser, the browser parses the DOM and begins rendering.
However, when external JS and CSS files are attached, the browser pauses the rendering until they finish loading; afterwards, it parses the remaining DOM tree. This slows down the page load and, consequently, the LCP time because the JS and CSS files block the rendering process temporarily.
Here are some recommended ways to reduce this:
Do not ship unnecessary JS and CSS bundles to the browser. If the JavaScript function is not needed on that page or the CSS style can be loaded later, then they do not need to compete with priority content during initial rendering. Frameworks like Astro and Gatsby already do an excellent job by shipping zero to little JavaScript to the browser by default.
Use server-side rendering. You can generate the page dynamically on the server and then send it to the client's user agent instead of shipping the complete JS to the client side and performing all the rendering there. The time it takes to build the page would increase, but the time it takes to render the page would decrease.
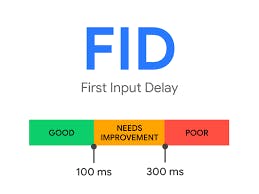
First Input Delay (FID)
This is the second of the core web vitals, and it is concerned with the user's experience when an action is taken on a webpage.
Simply put, First Input Delay (FID) measures the time from when a user first interacts with a page (that is, when they click a link, tap on a button, or use a custom, JavaScript-powered control) to the time when the browser is actually able to begin processing event handlers in response to that interaction.
What is a Good FID Score?
The ideal user experience has an FID of 100 milliseconds or less.
The Scope of FID
FID is Only Concerned With the First User Interactions:
As they say, first impressions matter the most, and that applies to the FID metric. Most of the interactivity issues occur during the first moments because that is when the critical page resources load; therefore, it is believed that focusing on the site's earliest interactions will improve the overall user experience and site reliability.
FID Only Measures Input Interactions:
User interactions must consist of finite input occurrences. That means it can only be something that has a distinct start and finish and expects a response, such as clicking a link, touching a button, or checking a box.
This means that continuous actions such as zooming a webpage, scrolling through a webpage, and adjusting the viewport will not be counted using this metric because these interactions do not require a response from the site itself.
What Causes Poor FID?
The major cause of poor FID on sites is Heavy JavaScript Execution. FID will be drastically reduced by optimizing the parsing, compilation, and execution of JavaScript on your website.
Browsers are not able to respond quickly to user input when there is an ongoing JavaScript execution on the main thread. It can take a long time for the browser to parse and evaluate these JavaScript bundles; consequently, inputs are delayed because they must wait for the page to load all the referenced JavaScript.
Large JavaScript bundles are caused by excessive third-party dependencies and unnecessary JavaScript not needed by the current page.
Another culprit for poor FID on sites is Long Running JavaScript Tasks. This is caused by poorly optimized code; a user input action is paused because of the running JavaScript function on the main thread. The browser will only handle the input after the JavaScript task finishes.
How to Optimize FID on Your Site
Optimize Long Running Tasks: Any piece of code that blocks the main thread for 50 milliseconds or more can be characterized as a Long Task. Enforcing efficient code patterns such as separating concerns, code splitting, memoizing expensive functions, and so on can significantly improve the FID score.
Reduce Third-Party Code and Unnecessary JavaScript: Excessive third-party libraries, tools, and dependencies can significantly impact the FID of a page since they ship huge bundles of JavaScript on page load.
Avoid importing any script not needed on a page, uninstall any unused package dependency, and limit the number of analytics and tag tools used on your site.
Use a Web Worker: Heavy-loading JavaScript blocking the browser's main thread is what leads to increased FID. Web workers make it possible to run non-UI-related tasks on a separate background thread while leaving the main thread available for user actions.
Good examples of web worker libraries:
Measure FID in JavaScript
Measuring FID in JavaScript is complicated; however, a basic monitor log can be created using some browser APIs.
The Event Timing API can be used to test out FID using JavaScript. This example creates a PerformanceObserver object that listens for first-input entries and logs them to the console:
new PerformanceObserver((entryList) => {
  for (const entry of entryList.getEntries()) {
    const delay = entry.processingStart - entry.startTime;
    console.log('FID candidate:', delay, entry);
  }
}).observe({type: 'first-input', buffered: true});
In addition, the Field tools listed above can be used to measure FID in more detail.
Cumulative Layout Shift (CLS)
This is the metric that measures visual stability in a website or web app; it is a stable Core Web Vital metric.
Imagine you are loading an e-commerce page in search of blue denim, and while scrolling down the page, you come across a link leading to a collection of blue denim. As soon as you attempt to click the link, it shifts so unexpectedly that you end up clicking something else. Annoying! That would be the word to describe your experience. This phenomenon is known as Cumulative Layout Shift (CLS).
Why CLS Happens
According to Google, there are five reasons why a layout shift could occur on a webpage:
Images without dimensions
Ads, embeds, and iframes without dimensions
Dynamically injected content
External Web Fonts
Actions waiting for a network response before updating DOM
The aforementioned elements have the potential to become what is known as Unstable Elements.
What Makes A Good CLS Score?
For the best user experience, sites should strive to have a CLS score of 0.1 or less. That being stated, it is important to note that the score is derived from the product of two parameters known as the impact fraction and the distance fraction.
layout shift score = impact fraction * distance fraction
Impact Fraction
Impact fraction is a measurement of how much space an unstable element takes up in the viewport.
In other words, when an unstable element initially appears at half of the viewport (50%) and then later shifts down to 25% of the viewport height, the total space moved by the element, in this case, is 75% of the total viewport (0.75). This is known as the Impact Fraction.
The dotted red lines in the second frame below illustrate it.
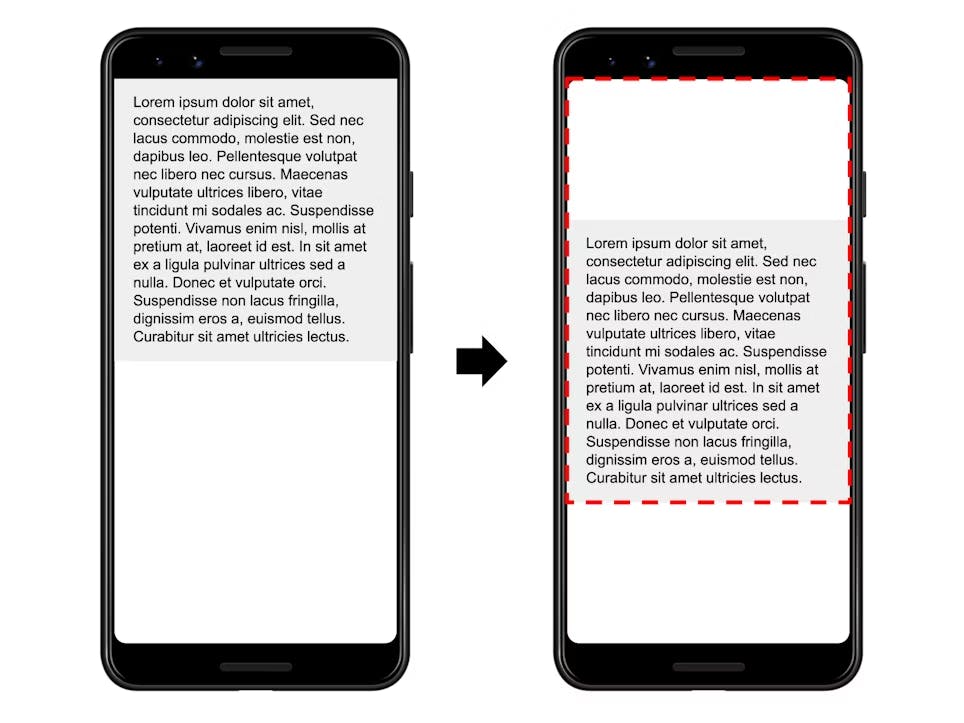
Distance Fraction
This is the other hand of the layout shift, it is the distance that the unstable element has moved relative to the viewport.
In summary, it is the greatest distance any unstable element has moved in the frame (either horizontally or vertically) divided by the viewport's largest dimension (width or height, whichever is greater).

Judging from the image above, the largest viewport dimension is the height, and the unstable element has moved by 25% of the viewport height, which makes the distance fraction 0.25.
So, in this example, the impact fraction is 0.75 and the distance fraction is 0.25, so the layout shift score is:
0.75 * 0.25 = 0.1875
There are a few more considerations that take into account other sub-factors, but this is the major thing you need to know about calculating CLS scores.
Ways to Reduce Layout Shifts on Your Site
Unlike the other Core Web Vitals, which are time-based values measured in seconds or milliseconds, the CLS score is a unitless value based on a calculation of how much content is shifting and by how far.
Include Dimensions in Your Images: Wherever you are using an image, video or any type of media, it is critical to always add
width, andheightattributes. An alternative approach will be to use the CSS aspect ratio to instruct the browser to reserve the required space in the DOM tree while the image is still loading.When using modern frameworks like Nextjs, it automatically calculates the width and height while the image is loading, (unless the image source is a remote image, then you must set your dimensions).
Optimize Loading Ads, iframes, and Dynamic Content: Unfortunately, images are not the only perpetrators of layout shifts, ads, embeds, and iframes also contribute to the largest percentage of shifts in sites.
Use CSS
aspect-ratioandmin-heightto reserve space for late-loading ads and contentAvoid displaying dynamic content without being triggered by the user's interaction
Handle Downloaded Web Fonts Correctly: Web fonts contribute to layout shifts because of the downloading and rendering processes of external web fonts. The shift happens when either of these two processes occurs:
The fallback font is swapped with the web font (FOUT—Flash Of Unstyled Text)
"Invisible" text is displayed using the fallback font until a web font is available and the text is made visible (FOIT—Flash Of Invisible Text)
This issue can be corrected by the following best practices:
Load critical web fonts as early as possible using
<link rel=preload>. A preloaded font will have a higher chance of meeting the first paint, in which case there's no layout shifting.Set the appropriate fallback for the particular font type.
Use the CSS Font Loading API for loading dynamic external fonts
Test Your Site Properly: Sometimes behaviour in production level can vary from the expected behaviour in development. This can be due to the fact that your browser development environment has most of the resources cached, along with a good internet connection; this will make it difficult to spot layout shifts while developing your site.
Hence, it is crucial to test your site properly across different browsers and devices using the Lab Tools and Field Tools listed earlier in this article.
Conclusion
I hope this article helps you understand the foundations of building performant web software with an excellent user experience.
I would appreciate you give me a follow on Twitter.